Dan Nolan

Visual Designer
User Experience Designer

DJN monogram
Project:

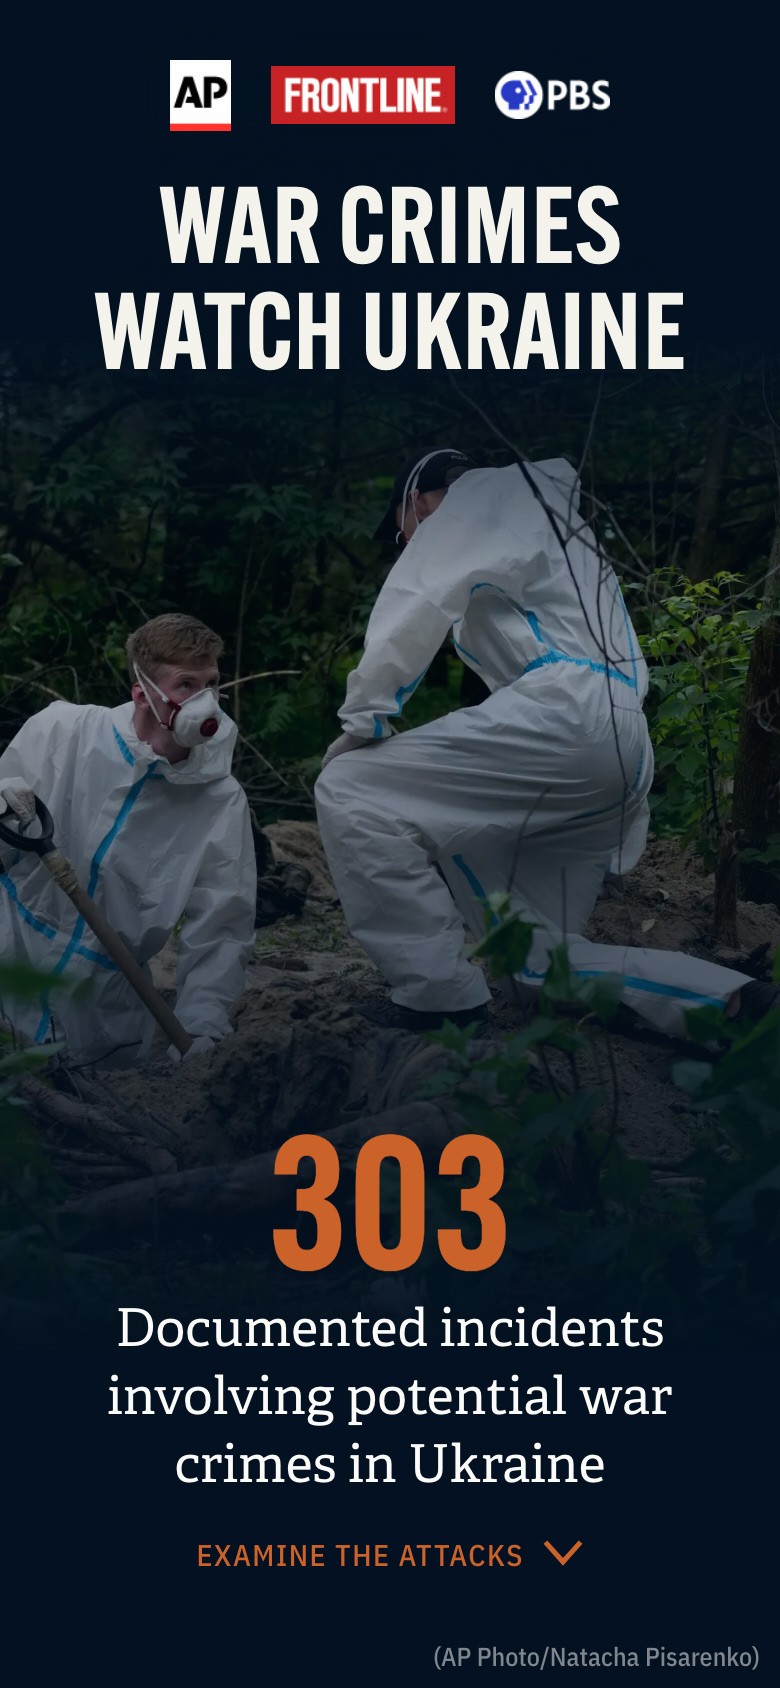
War Crimes Watch Ukraine

Year:

2022

Roles:
  • user experience
  • visual design
  • CSS
View live site >
A composite image showing two screenshots of a web application and database. The first image shows photographs of war crimes and text describing the number of current potential war crimes; the second image shows a list of potential war crimes represented by icons.

In the weeks following the Russian invasion of Ukraine, FRONTLINE partnered with the Associated press to document potential war crimes happening in the country. This set the wheels in motion at FRONTLINE on our special projects team—I began sketching out design directions that would later become a public database documenting hundreds of potential war crimes in Ukraine.

A sketch of a web application and database of potential war crimes in Ukraine showing icons of dead and injured for each incident.
A sketch of a web application showing potential war crimes and their location on a map of Ukraine.
A sketch of a web application about potential war crimes in Ukraine. The scrolling page shows different visual representations of the data: icons of dead and injured, icons of buildings and a map with locations highlighted.

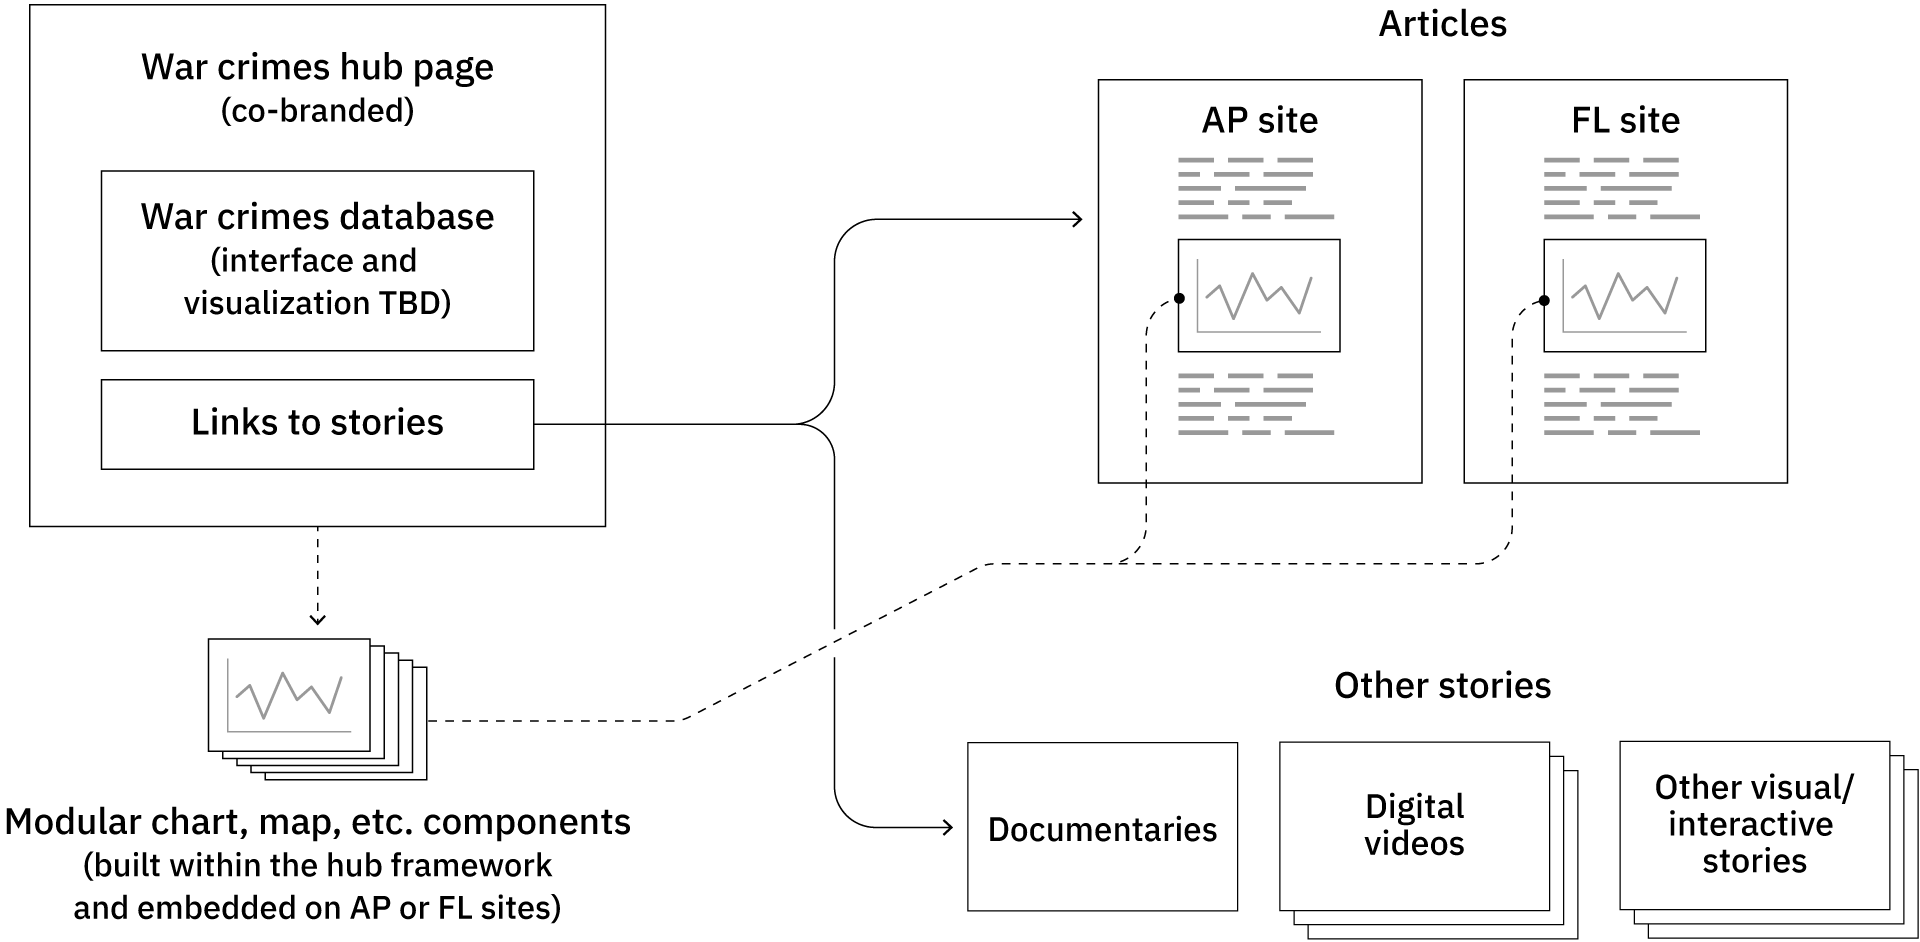
I mapped out how this web application and database would integrate into the websites of the two partners.

A diagram of the war crimes web application and how it integrates into other partner websites.

My initial design challenge was to figure out how to represent each attack visually. I created rough wireframes, first looking at the attacks by showing dead and injured for each one. We quickly realized that it would be too difficult to verify the number of dead and injured in such a volatile situation, so this solution didn’t work. I adjusted this direction and moved towards showing the attacks in a different way.

A web application wireframe showing a database of war crimes in Ukraine represented by icons of dead and injured.
A web application wireframe showing a database of war crimes in Ukraine with icons of buildings and people for each attack.

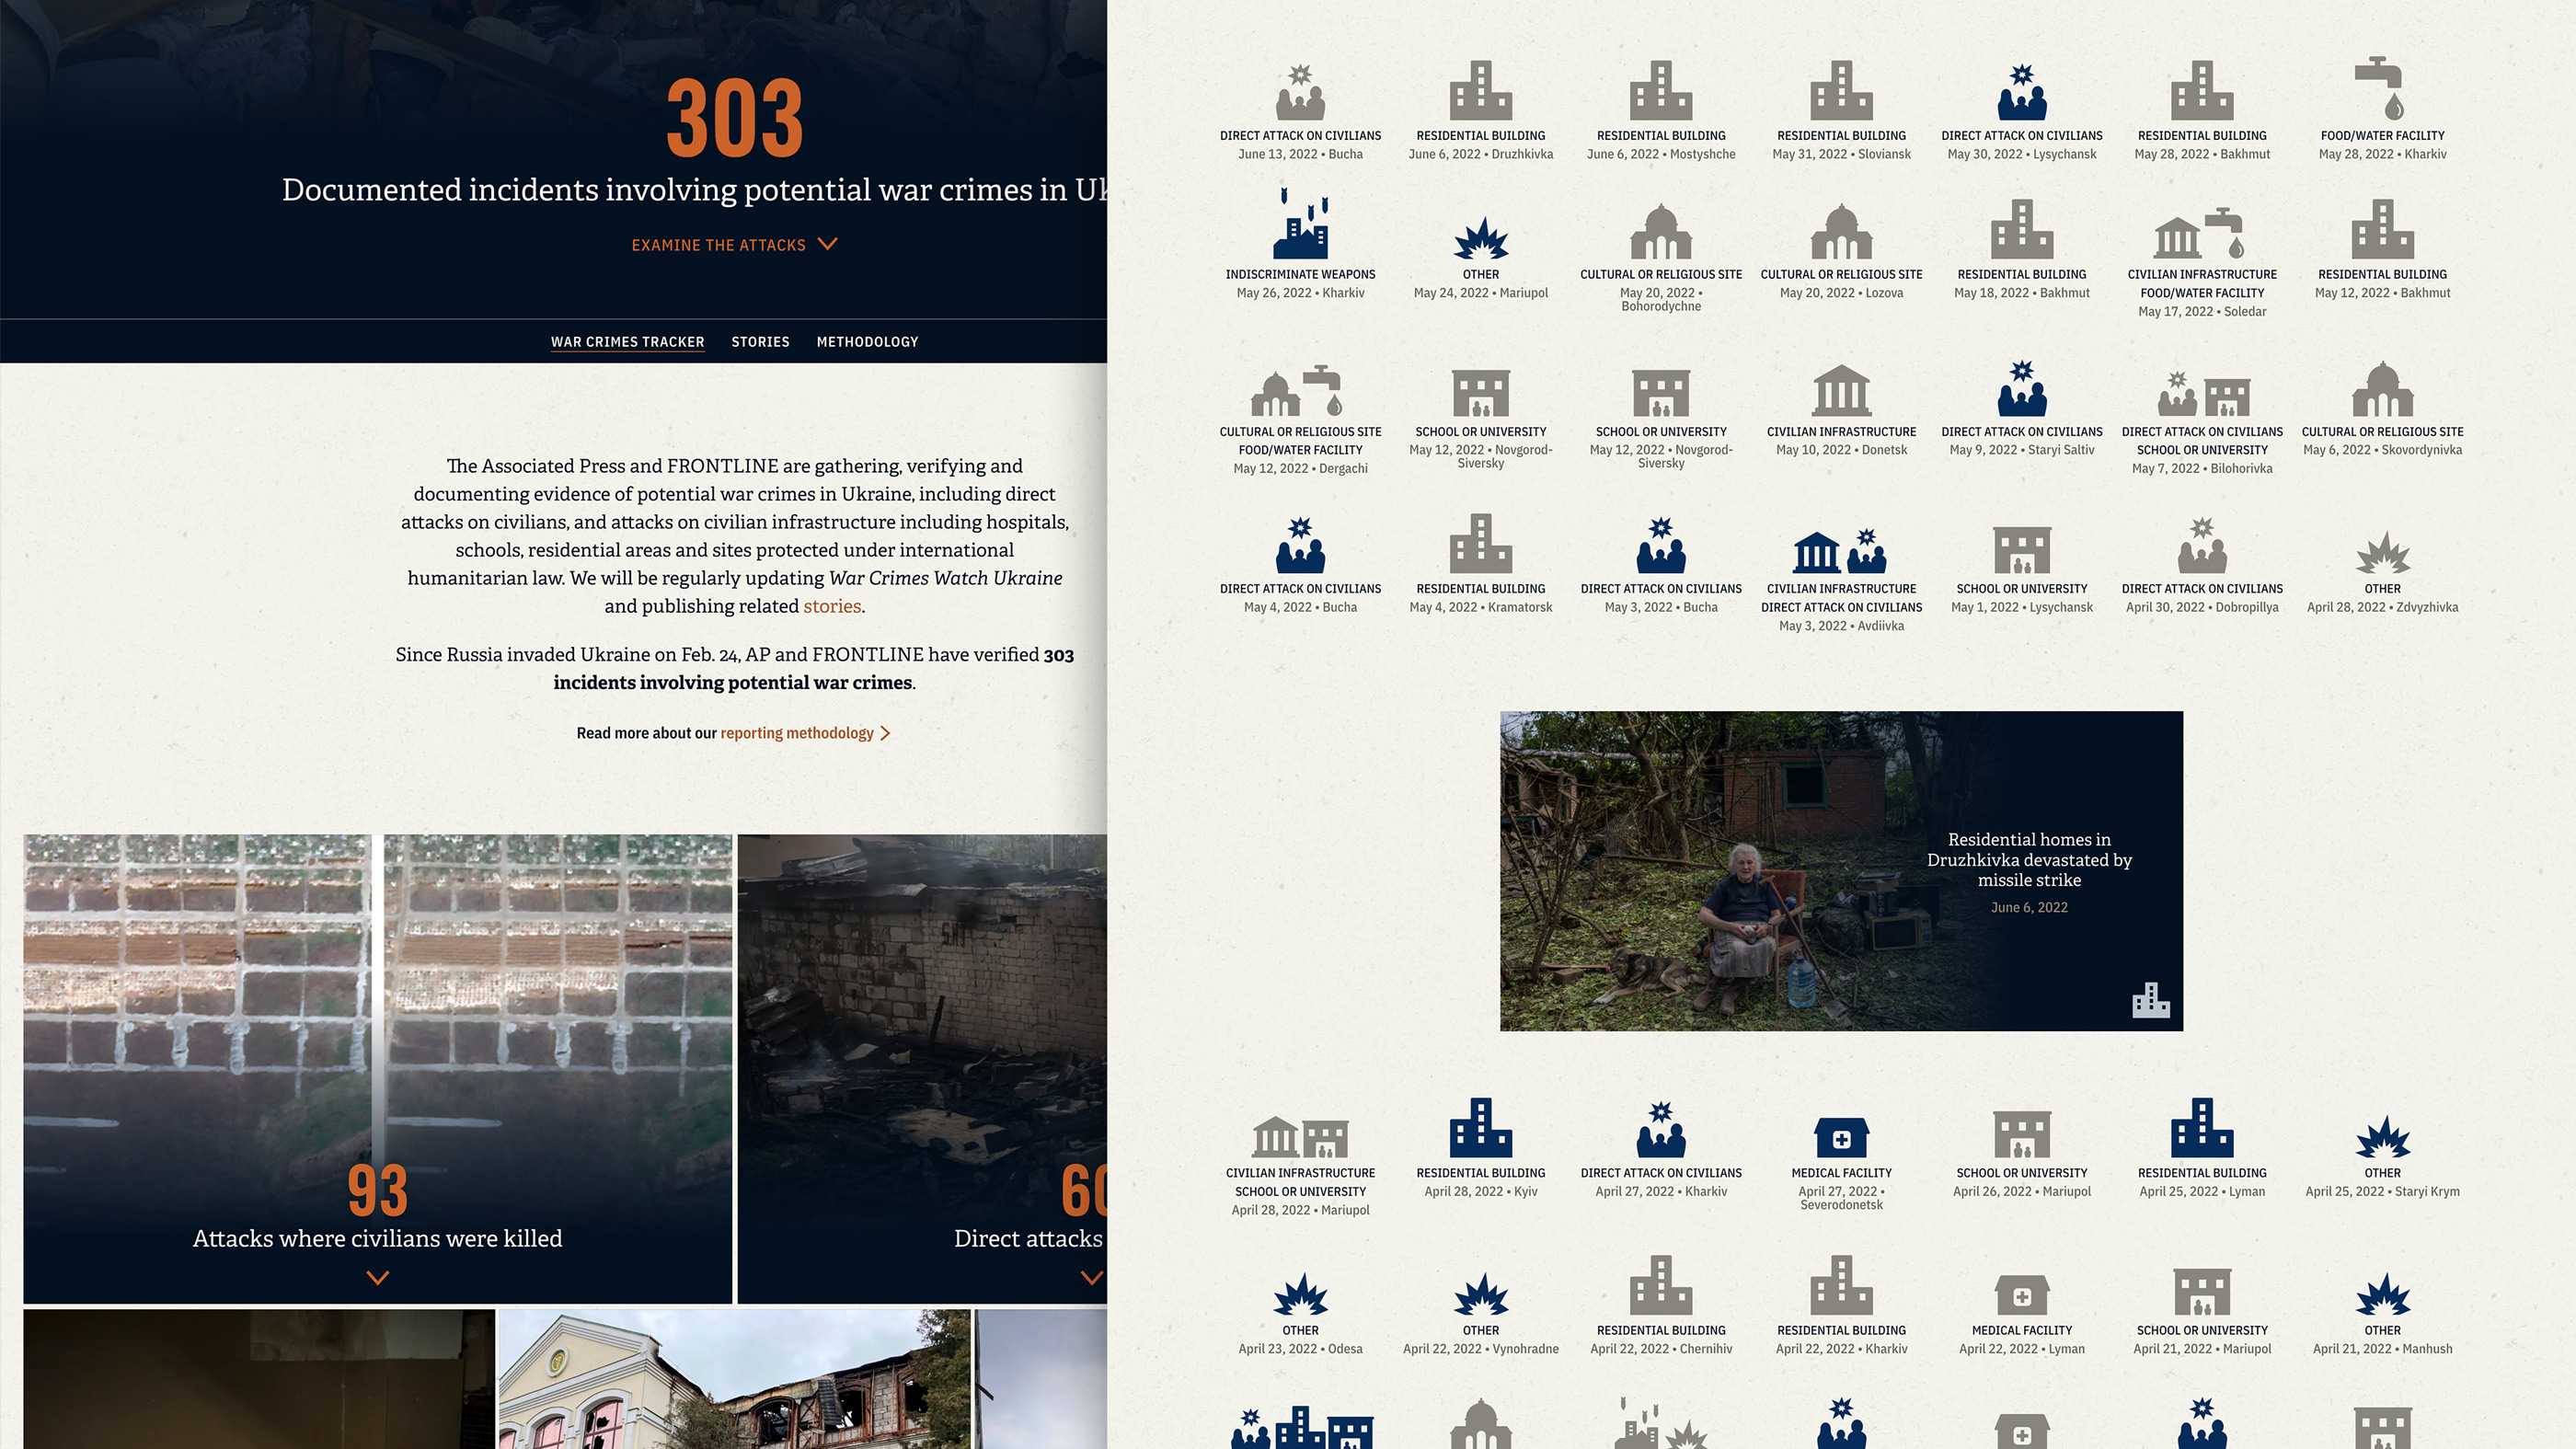
The reporting team was developing categories for each type of war crime to tag the attacks with, so I designed a system of icons to go along with this. Our plan was to use these icons as the primary visual representation of each attack.

A list of icons representing 10 different war crimes: Medical Facility, Residential Building, Cultural or Religious Site, School or University, Direct Attack on Civilians, Indiscriminate Weapons, Food/Water Supply, Civilian Infrasctructure, Other and Torture.

Images of atrocities are hard to look at but are a necessary part of an experience trying to document what’s happening on the ground in Ukraine. We use photos and videos throughout the experience to emphasize the human impact and to document each attack.

A web application screenshot showing imagery of potential war crimes in Ukraine with graphic text showing the number of potential war crimes currently documented: 303.

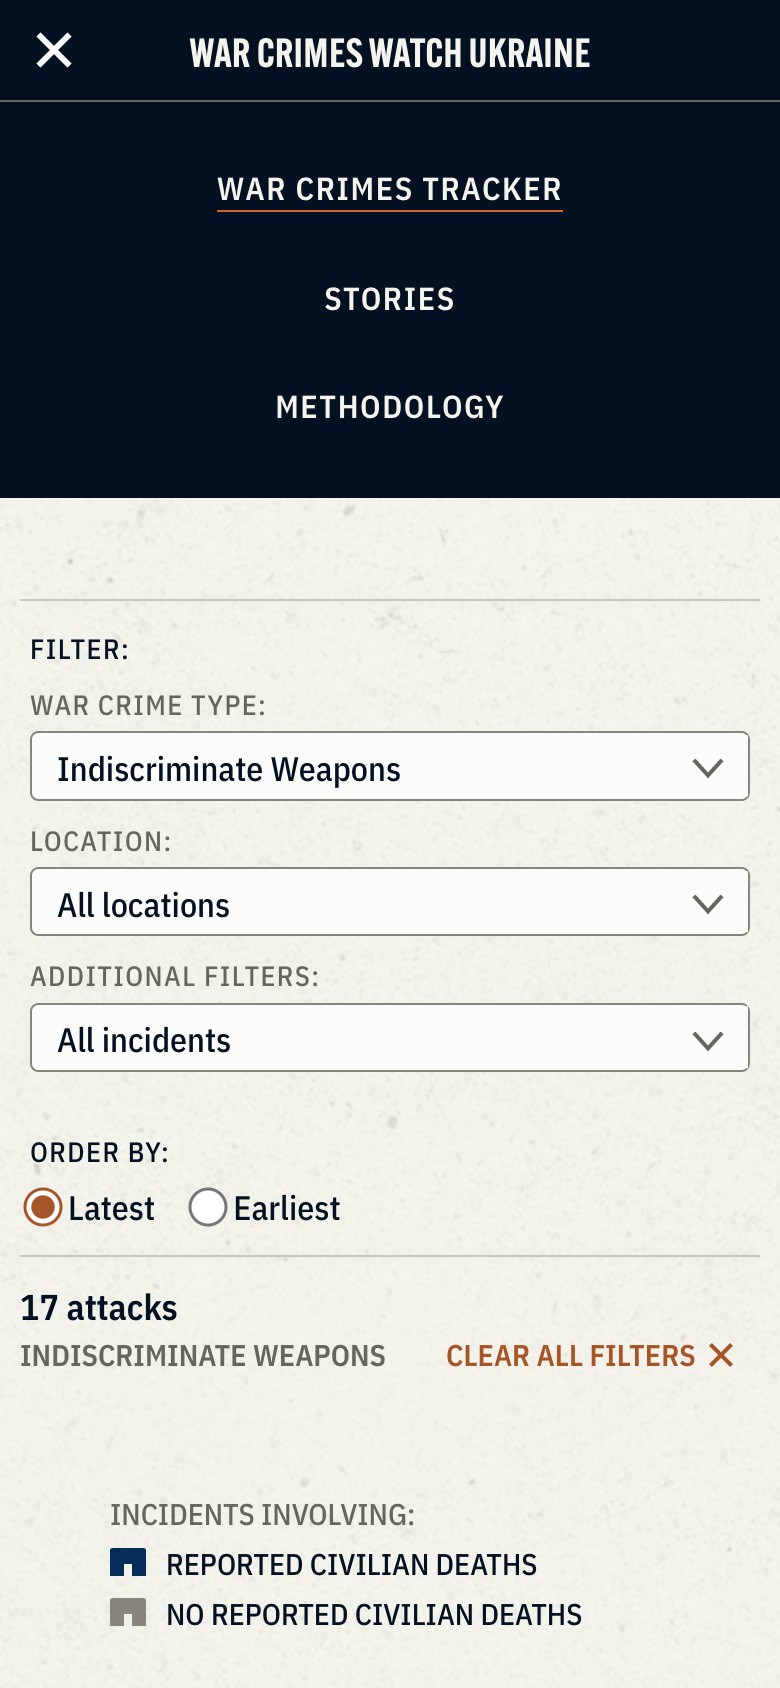
We display a counter at the top that updates daily as the reporting team works to verify each attack. And the attacks can be filtered by the type of war crime and the location in Ukraine.

A mobile screenshot of a web application about potential war crimes in Ukraine showing an image of two men examining a mass grave site. Text at the bottom displays the current number of potential war crimes documented in Ukraine: 303.
A mobile screenshot showing navigation and a filtering interface for a war crimes database.

The icons, taken together in order, present a picture of the devastation happening on the ground in Ukraine as well as an accurate document of the atrocities of the war.

A screenshot featuring a list of dozens of icons making up a database of potential war crimes in Ukraine.