Project:
Flint Water Crisis Deaths
FRONTLINE made a film about the Legionnaires’ disease outbreak that occurred during the Flint water crisis. Our reporters uncovered an excess of pneumonia deaths during the crisis that were suspected to be undiagnosed Legionnaires’ disease cases. We worked with a team of epidemiologists to help us figure out if these deaths could be linked to the Flint water.
Our investigation and analysis “strongly suggests” that there were more deaths than the official count of 12 given by the state, as our story explains.
The film does an amazing job of taking the viewer through a timeline of the crisis and showing the lives that were impacted. We wanted to create an interactive data explainer that showed exactly how we found these additional pneumonia deaths and how we linked them to the water crisis.
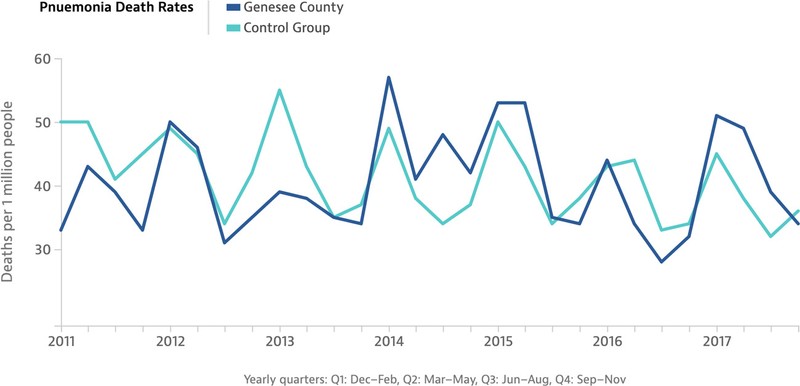
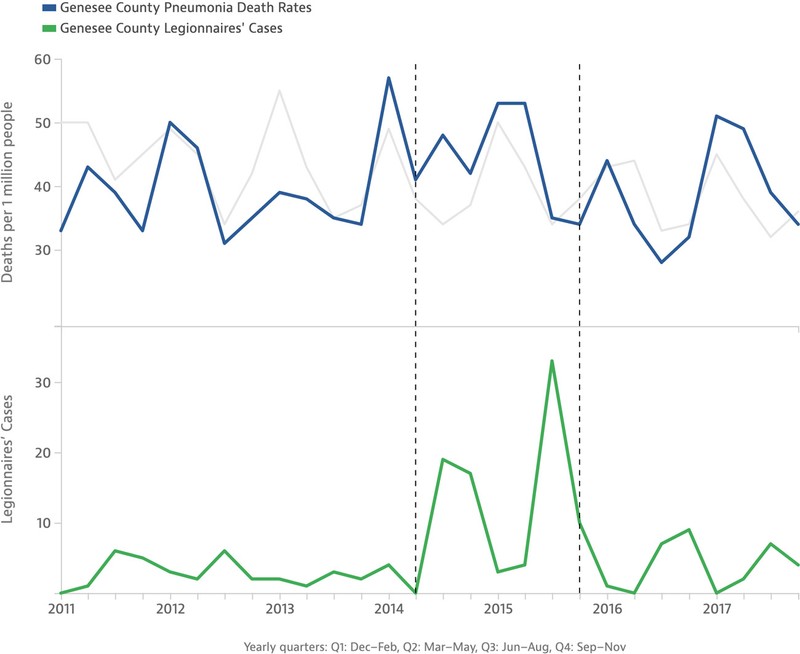
The analysis did reveal an excess of pneumonia deaths that occurred during the Legionnaires’ disease outbreak. But the excess deaths are hard to spot when looking at a standard chart visualization. I proposed a scrolling, animated data visualization experience that would step the audience through details of a chart and point out key areas where the deaths occurred.
We compare the Flint (Genesee County) deaths to a control group.
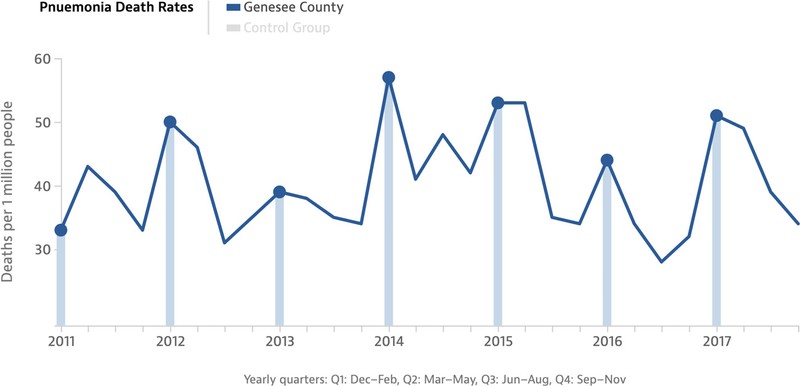
And highlight seasonal trends with pneumonia.
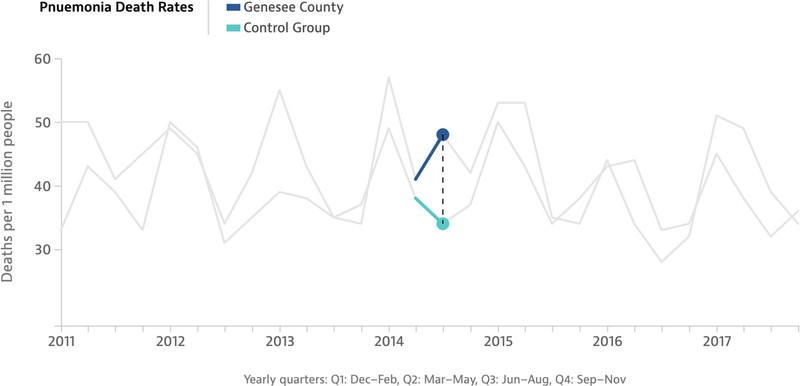
We point out a key moment where the pneumonia deaths increase uncharacteristically during the summer.
This timing lines up with the switch to the Flint River water and the beginning of the Legionnaires’ disease outbreak.
Read the story and view the full experience.
