Project:
Early Databases and Explainers
Early in my time at FRONTLINE, I designed a handful of smaller projects that turned data and reporting into focused, compelling web interfaces — from police department accountability records to concussion tracking to solitary confinement statistics.
Concussion Watch
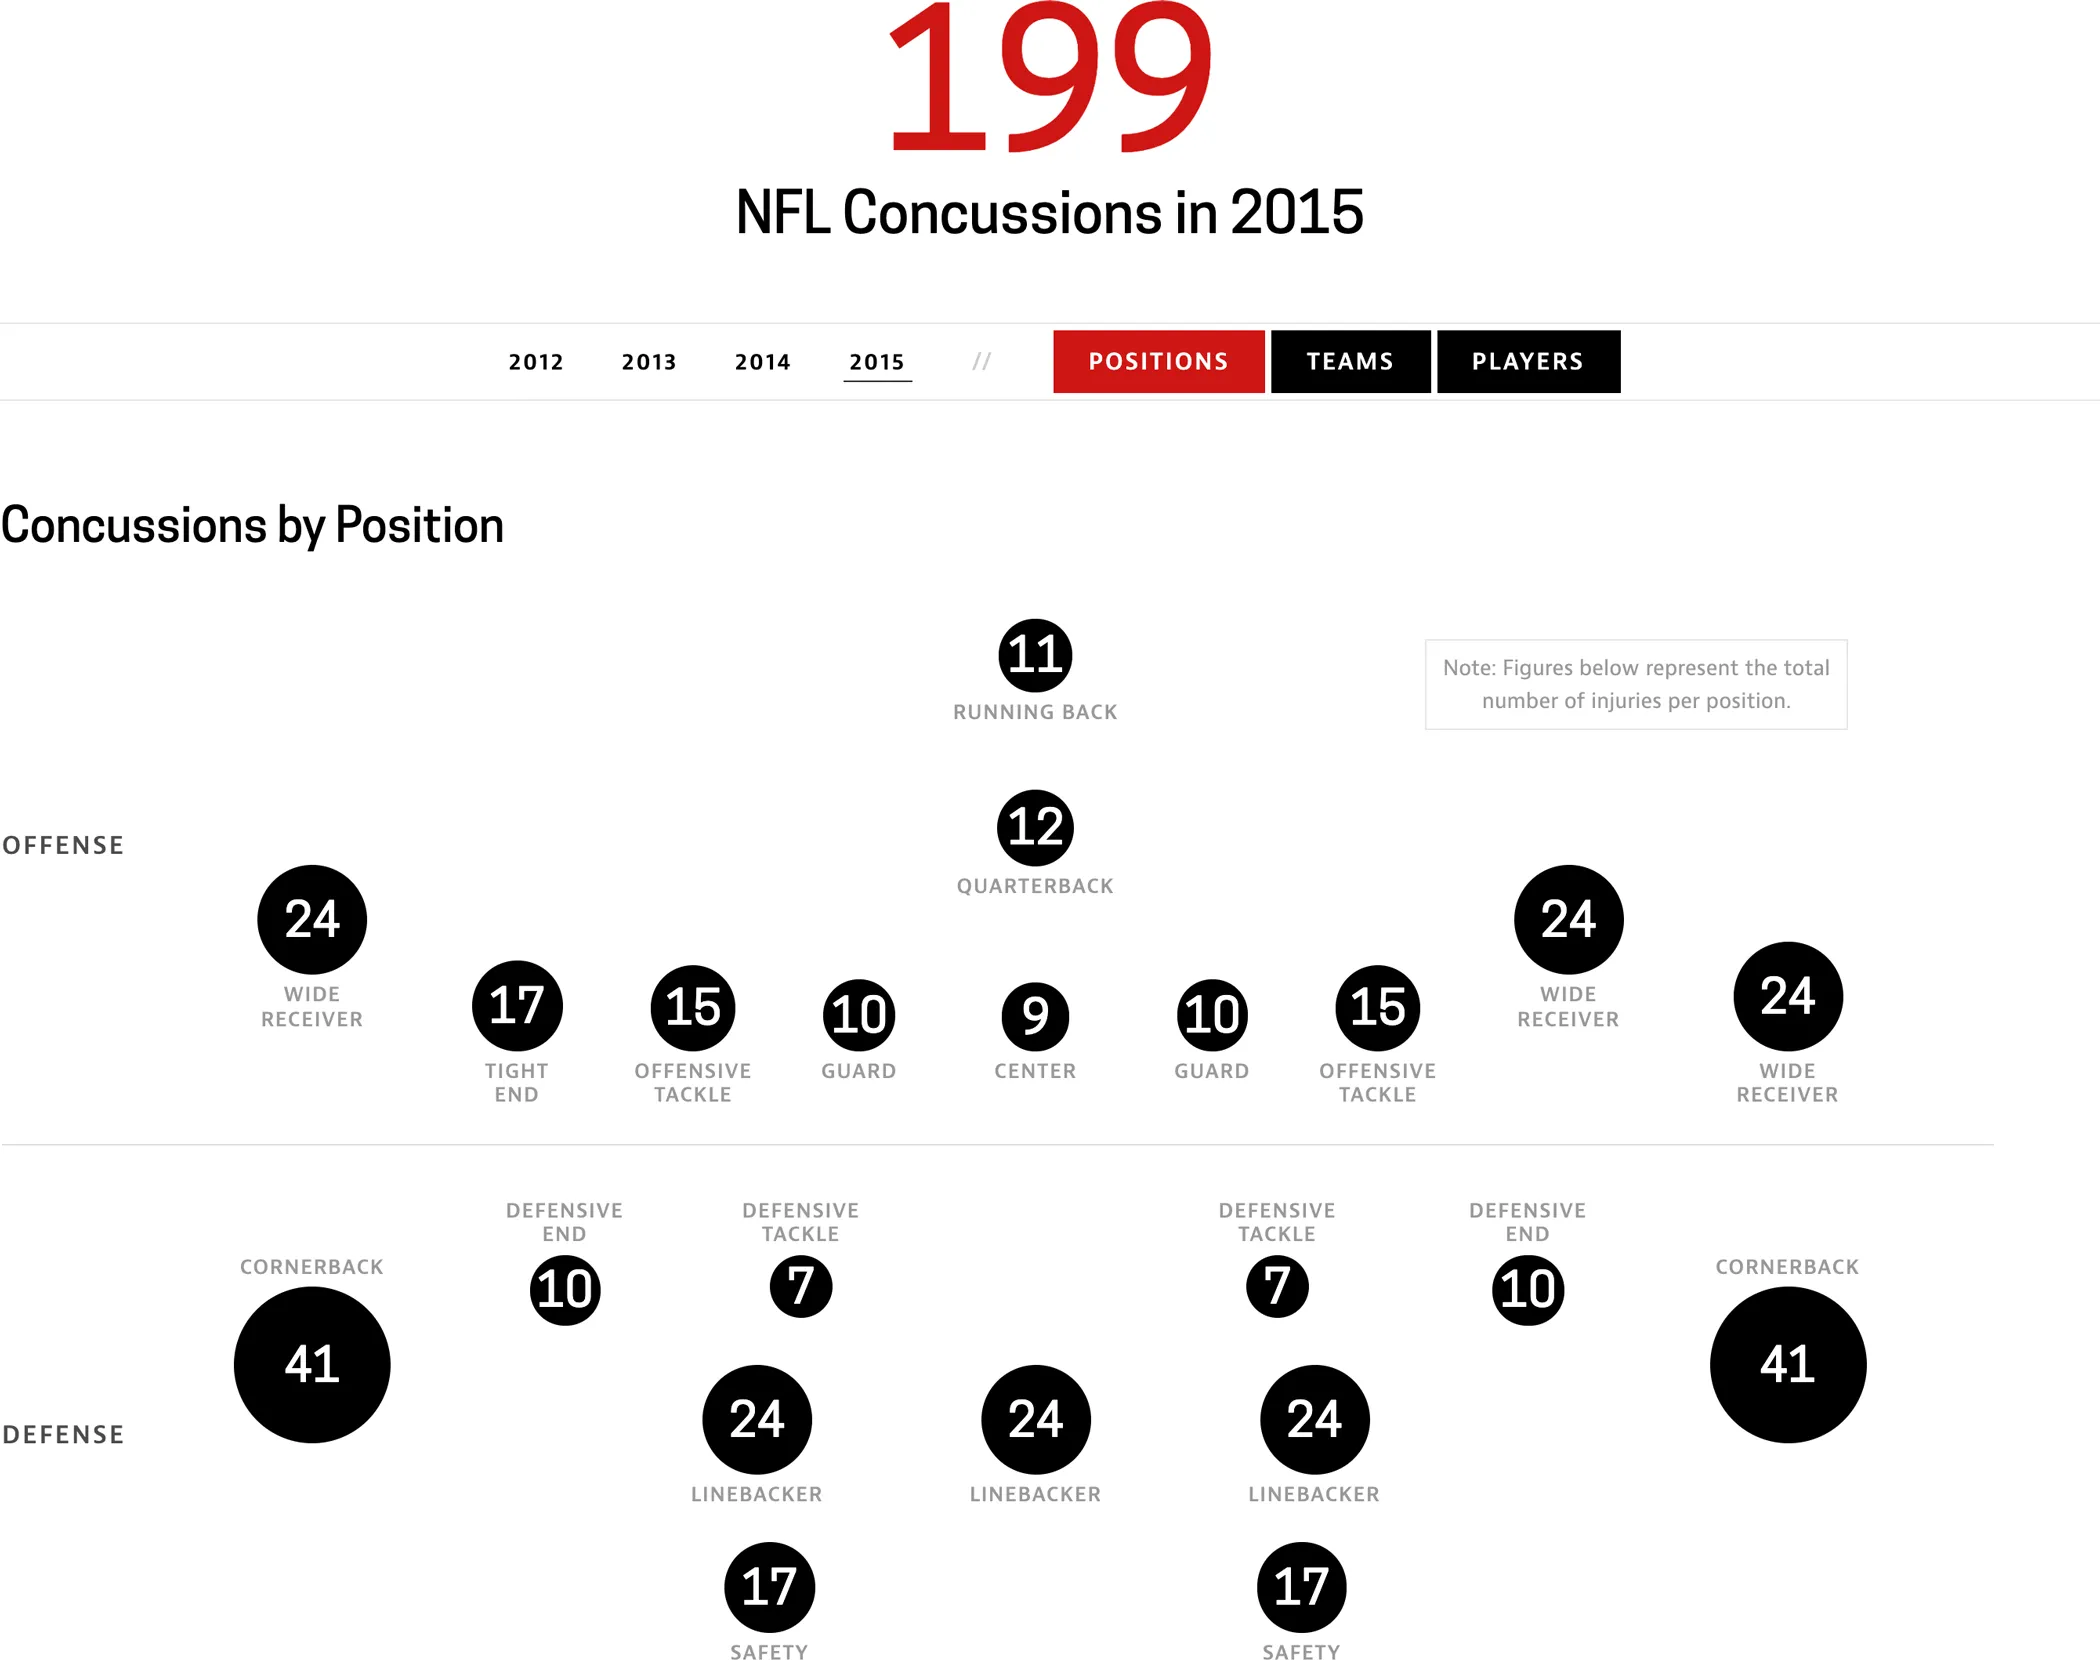
Concussion Watch is an interactive database and visualization that tracks the number of concussions in the NFL. This project was originally created in 2012. Since it was one of FRONTLINE’s most highly trafficked and continuously updated interactives, we decided to refresh the design in 2015 and make it responsive along with the redesign of the FRONTLINE website.
I was responsible for evaluating the existing user experience — deciding which parts of the flow to keep and where we needed to revisit. I kept the core of the experience intact but cleaned up the layout, improved the hierarchy of information and made the interface clearer.
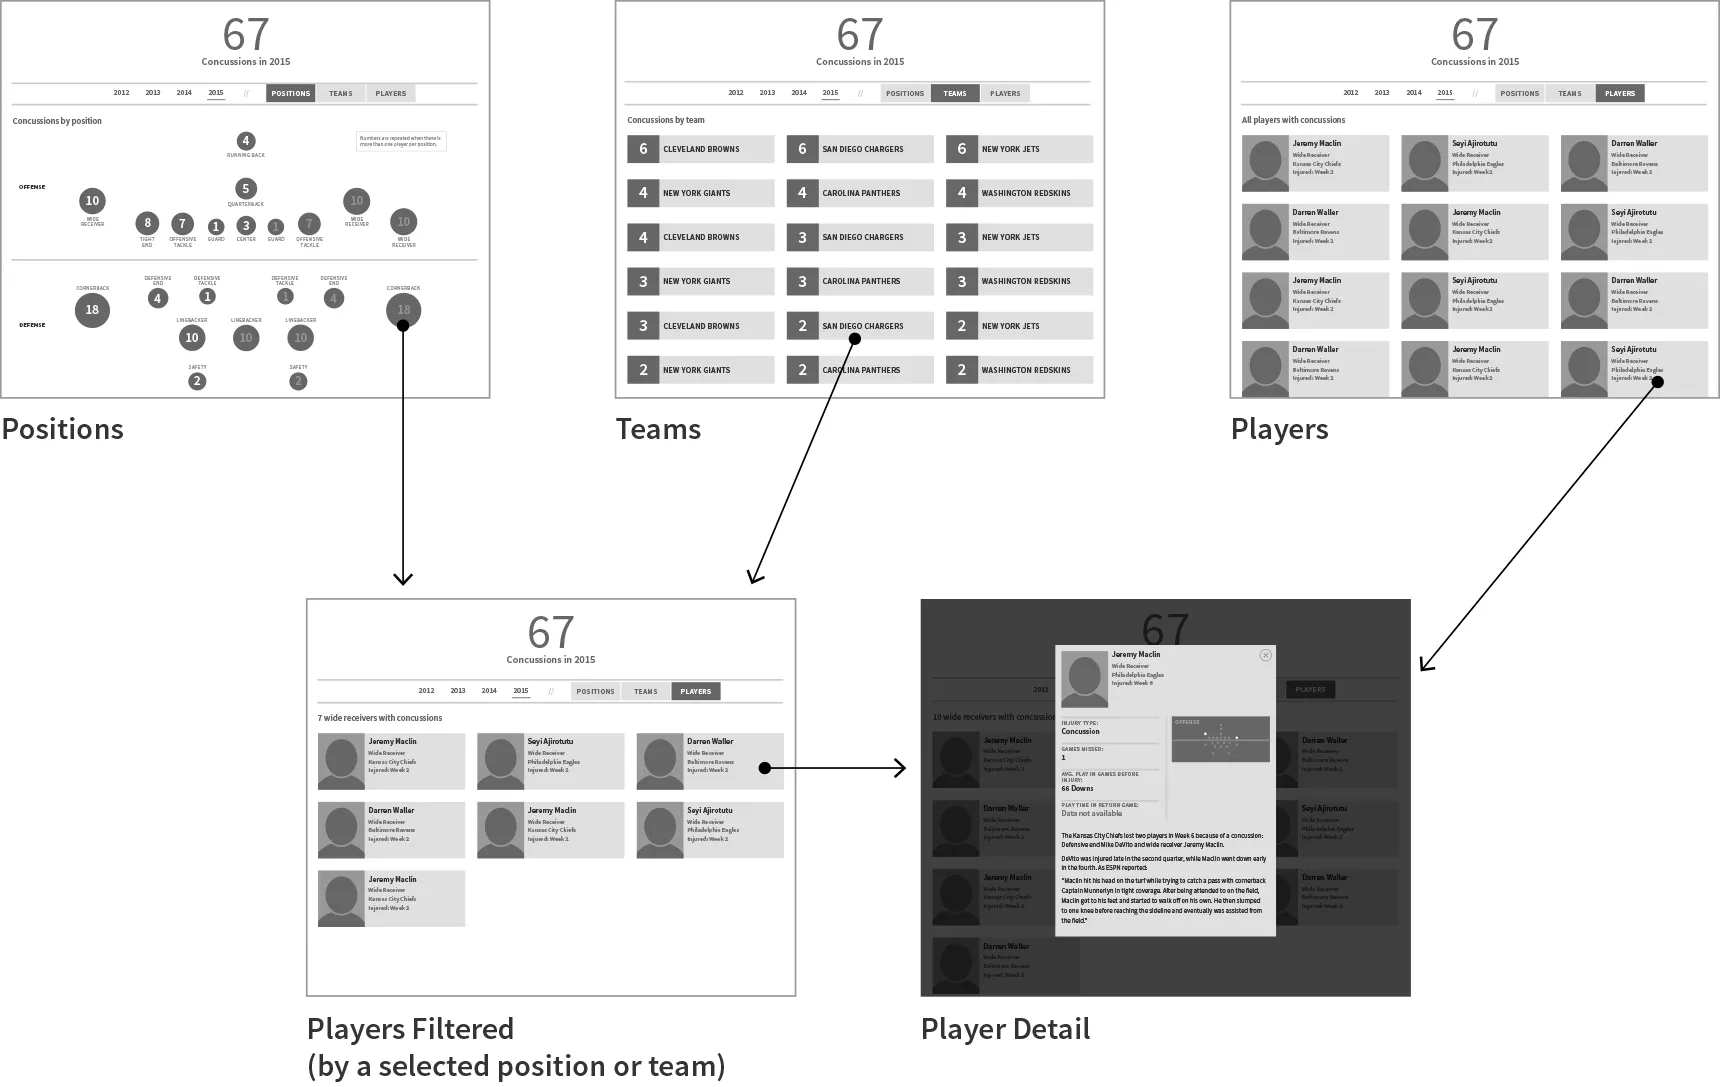
This was an opportunity to apply the new visual language of the FRONTLINE website redesign to a more specific context.
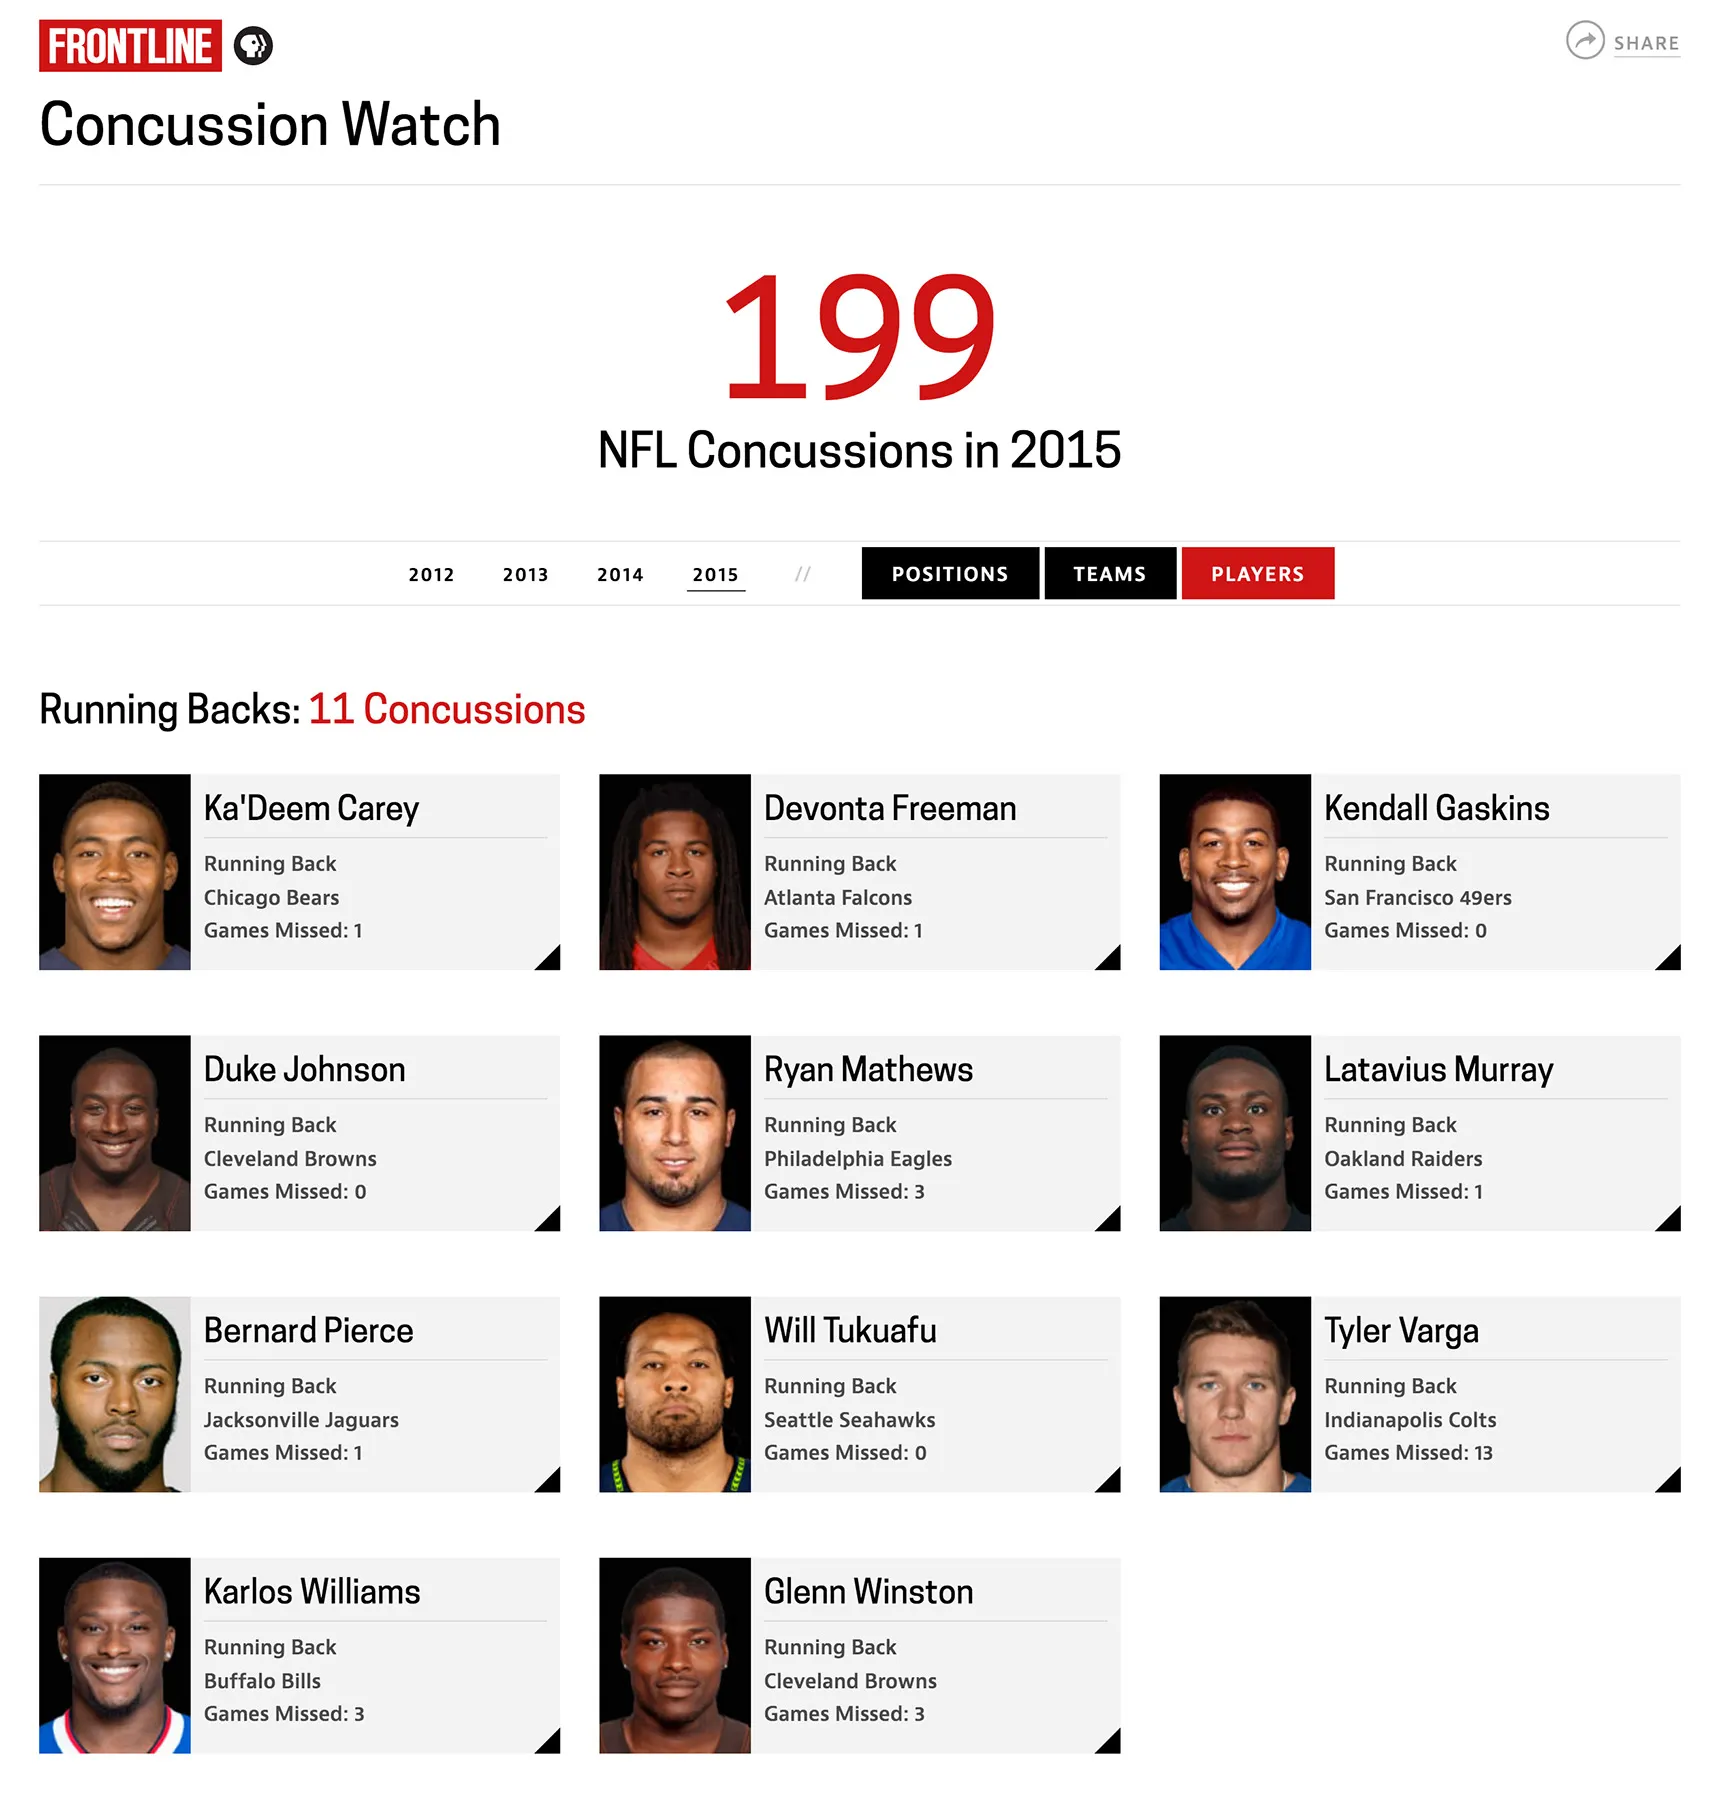
FRONTLINE deals with difficult and sensitive topics. Designing for data and reporting about concussions was an exercise in restraint and minimalism. While the FRONTLINE site is dominated by photographic imagery and video, the design here needed to be clean and bold and driven by typography, so the concussion numbers could stand alone without distraction.
Fixing the Force
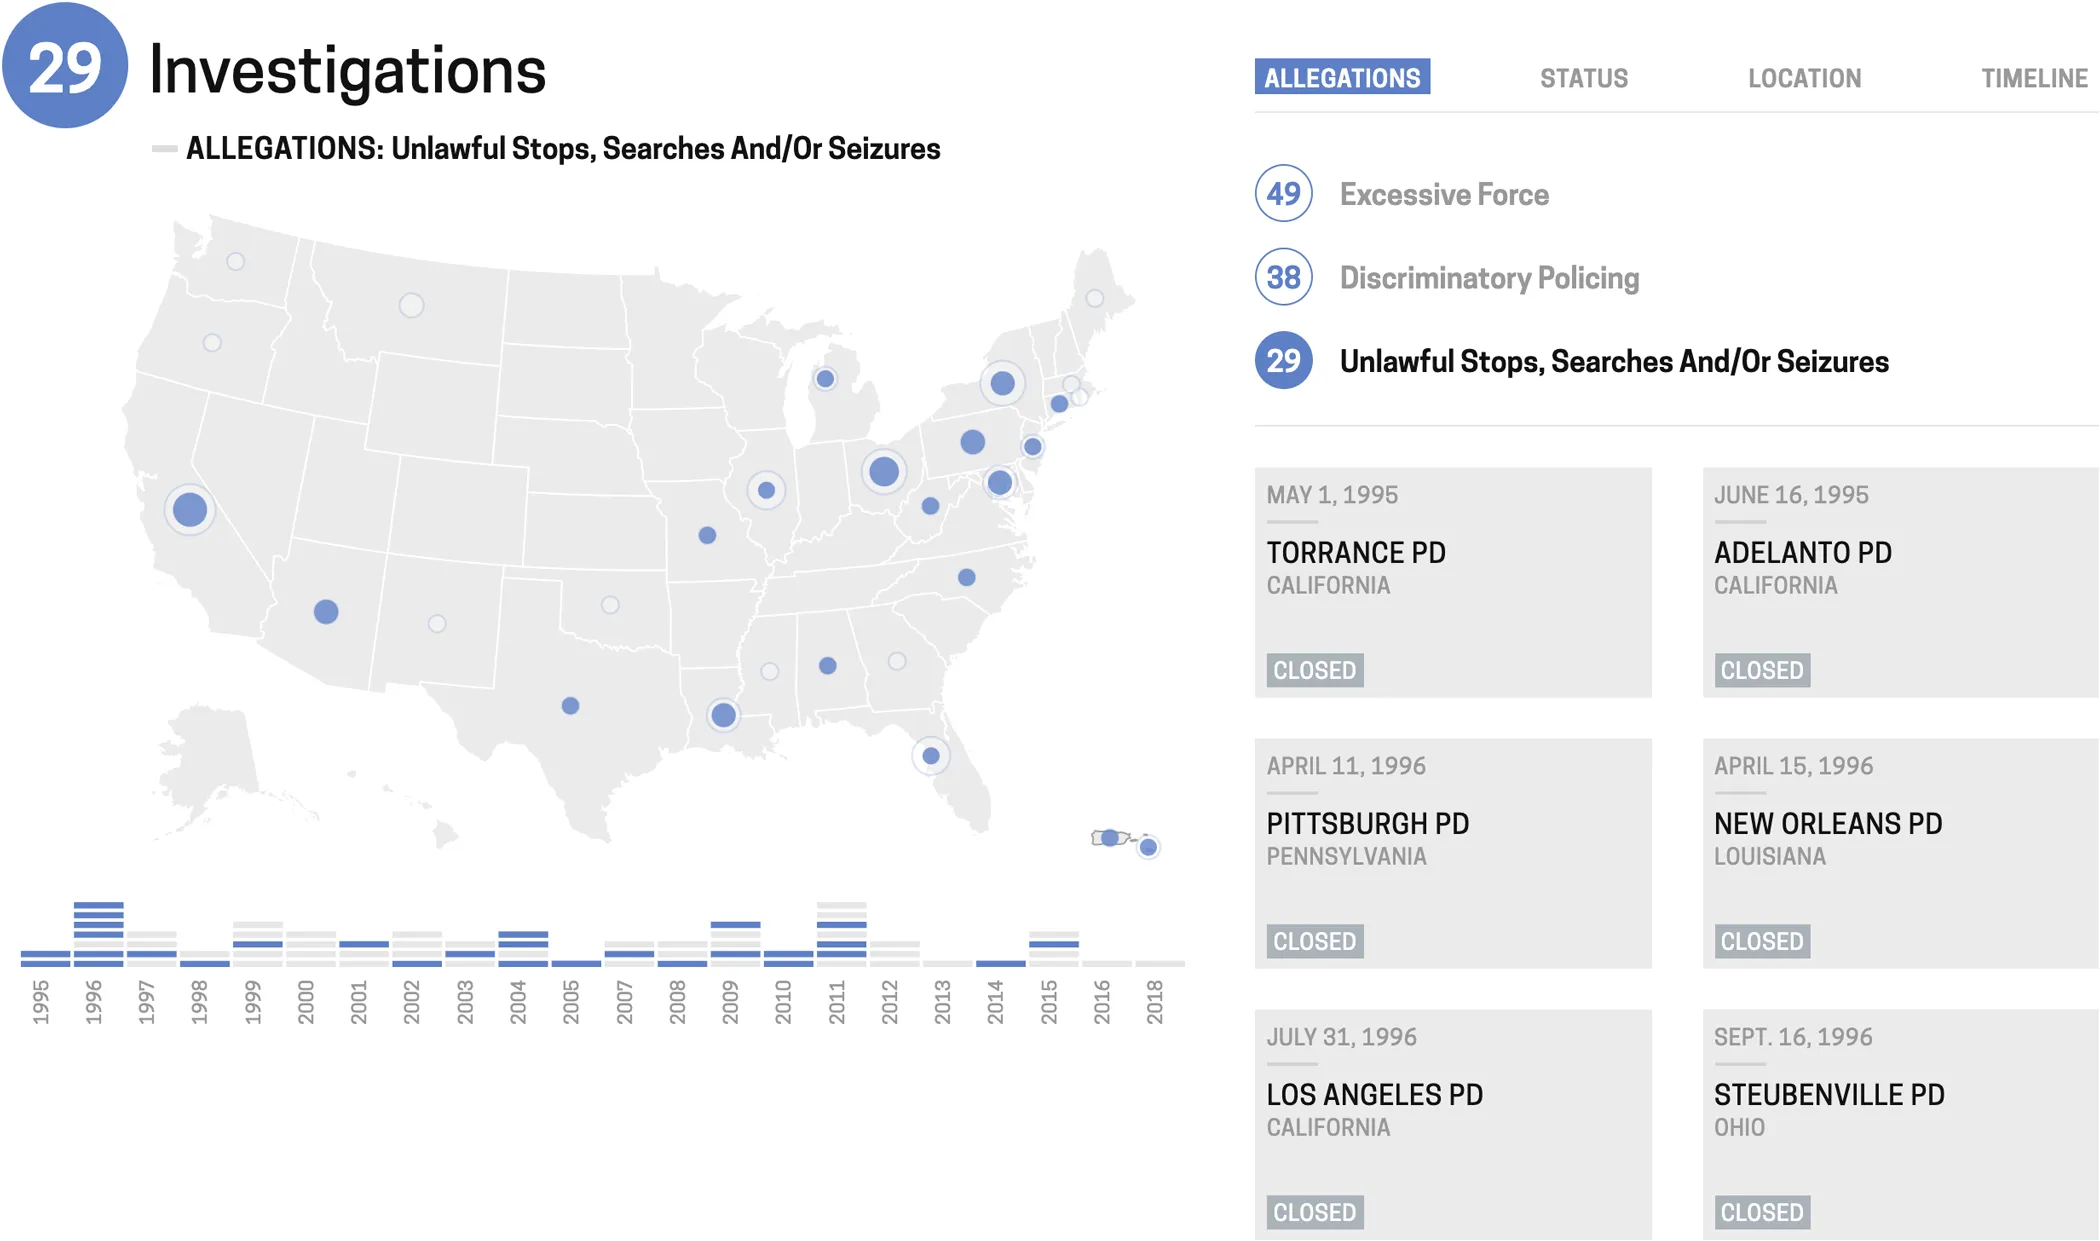
Fixing the Force is a database of all police departments that have been investigated by the Department of Justice since 1995. There’s a lot of information packed into a small space. The data is visualized through a map and a timeline that allow the user to make comparisons between the investigation locations or groupings in time. A categorized list provides a more detailed way of breaking down the departments, primarily by allegations like use of force and discriminatory policing. The user can then select a department for a detailed text description of how the investigation started and where it currently stands.
Solitary By the Numbers
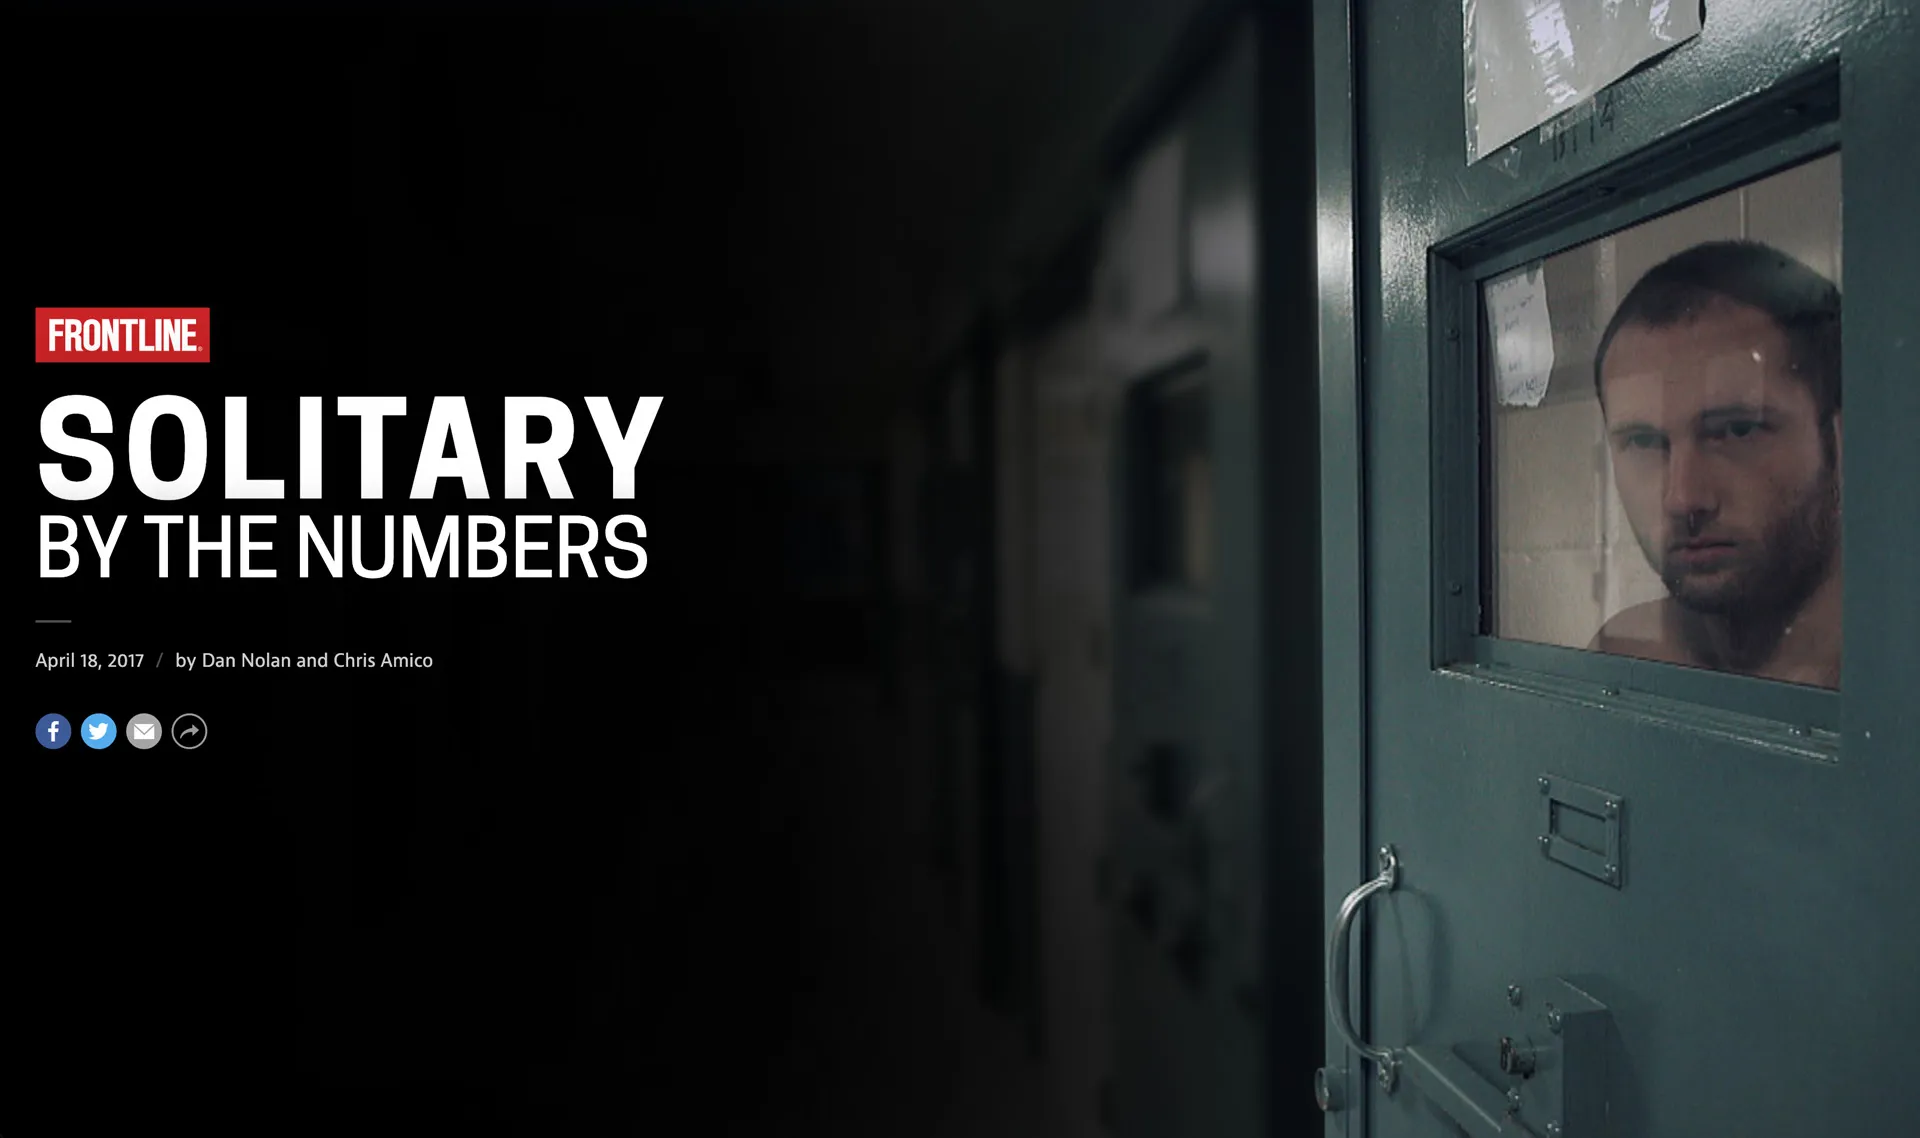
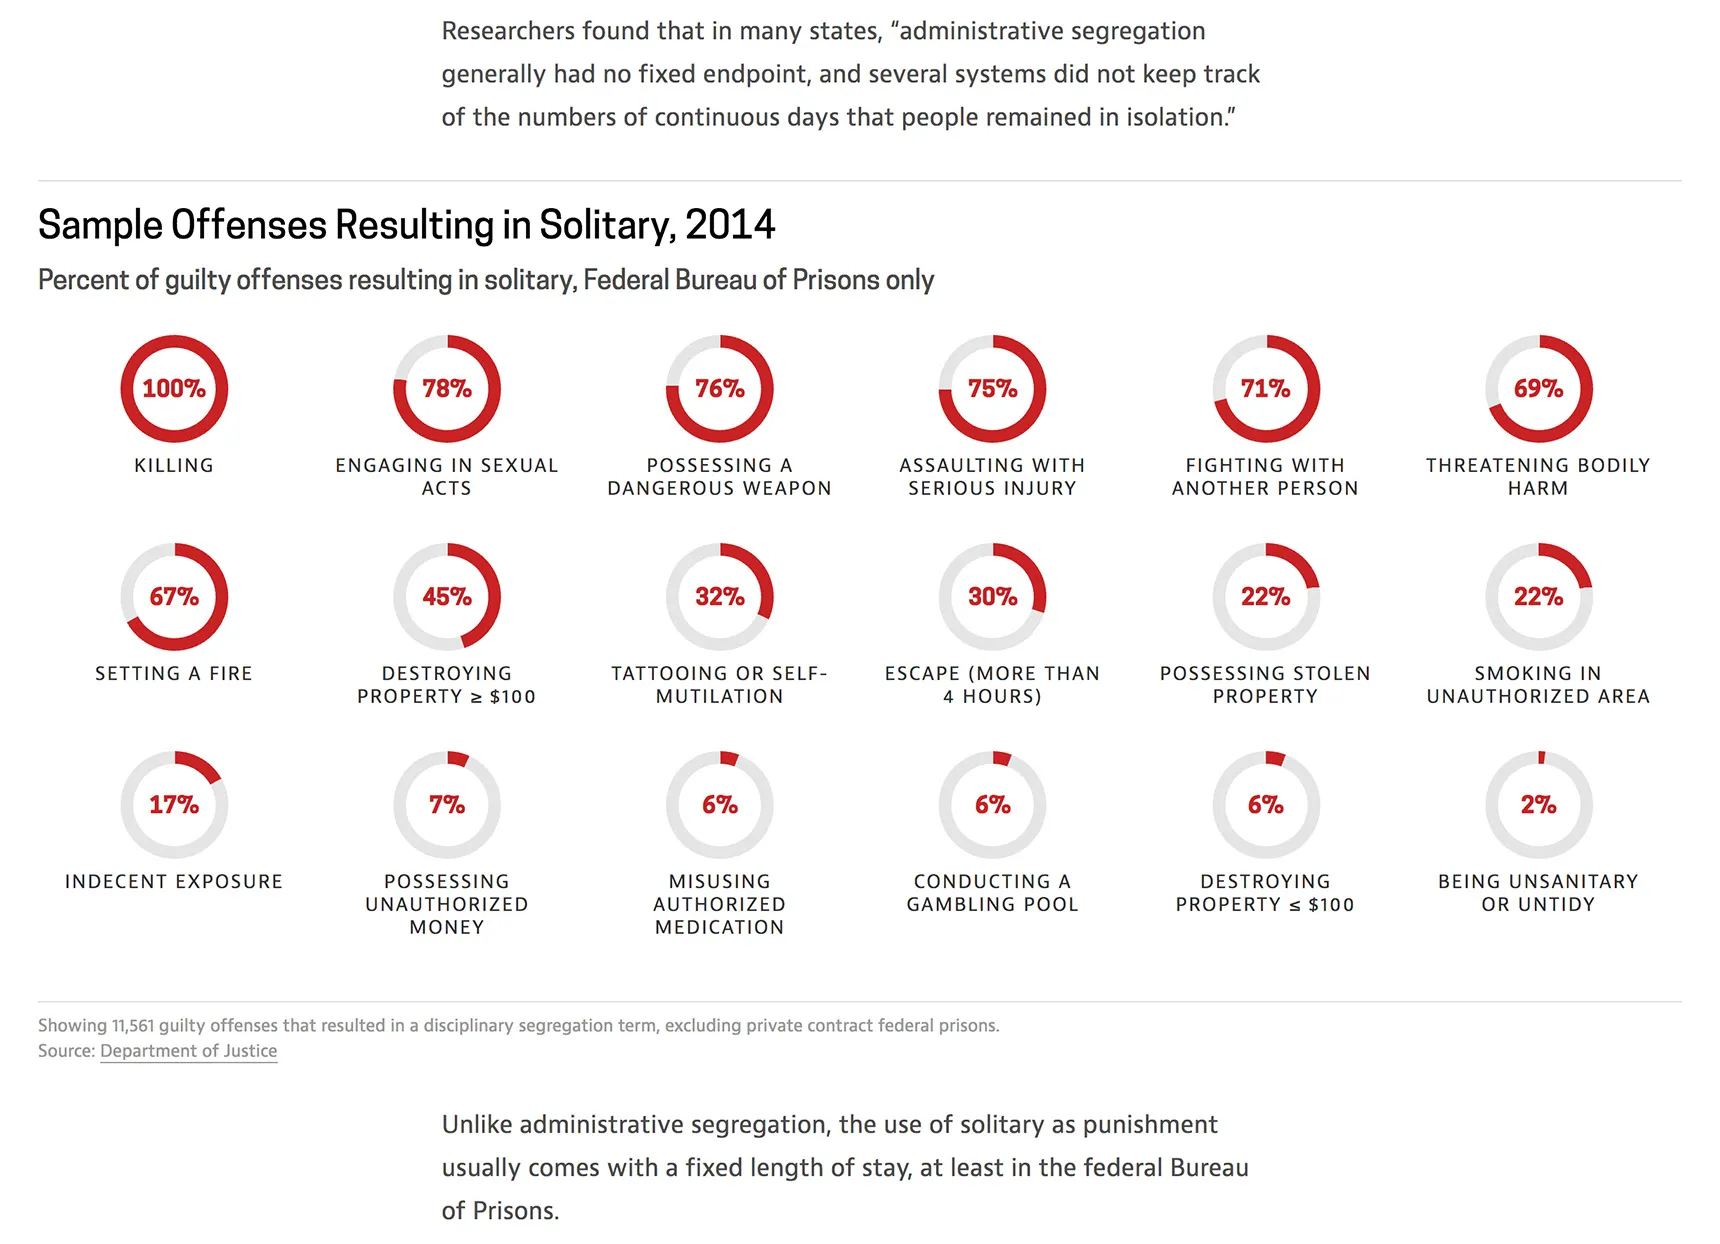
Solitary By the Numbers is a data explainer that grew out of the FRONTLINE film Last Days of Solitary, which provides an up-close look at solitary confinement from one prison in Maine. With the release of this film our digital team decided to take a broader look at solitary in this country. We wanted to answer some basic questions about the state of solitary today: How many prisoners are in solitary? How long do they stay there? Which states house the most prisoners in solitary? I took the lead in researching the data and sketching out the charts. We built out a scrolling explainer story with embedded charts that introduces the issue of solitary confinement and digs into different breakdowns of the data.
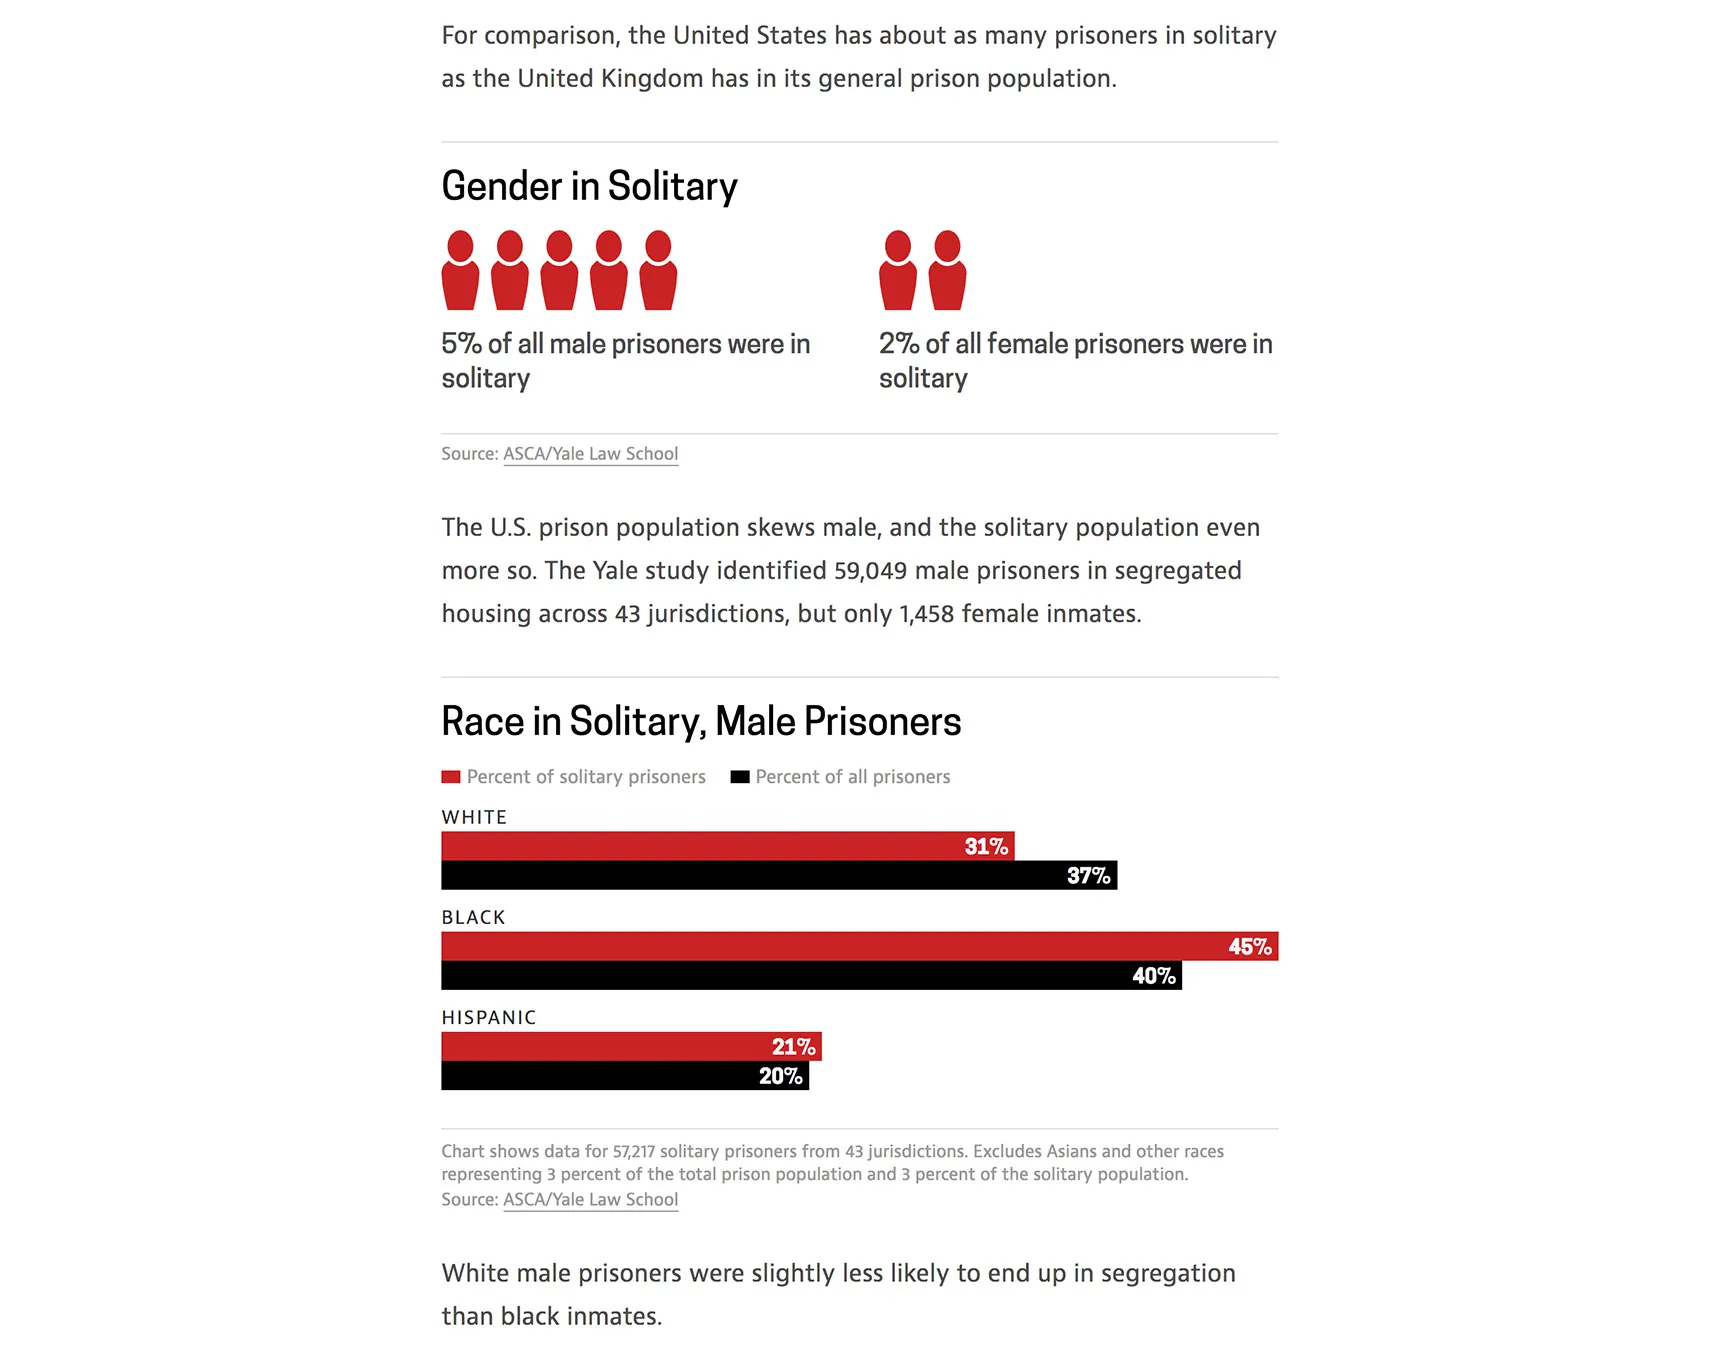
Most of the charts show simple percentages, so I decided that bar graphs were an effective solution. This also meant we could build the charts out fully in HTML and CSS so they scale down and display optimally for different device sizes.
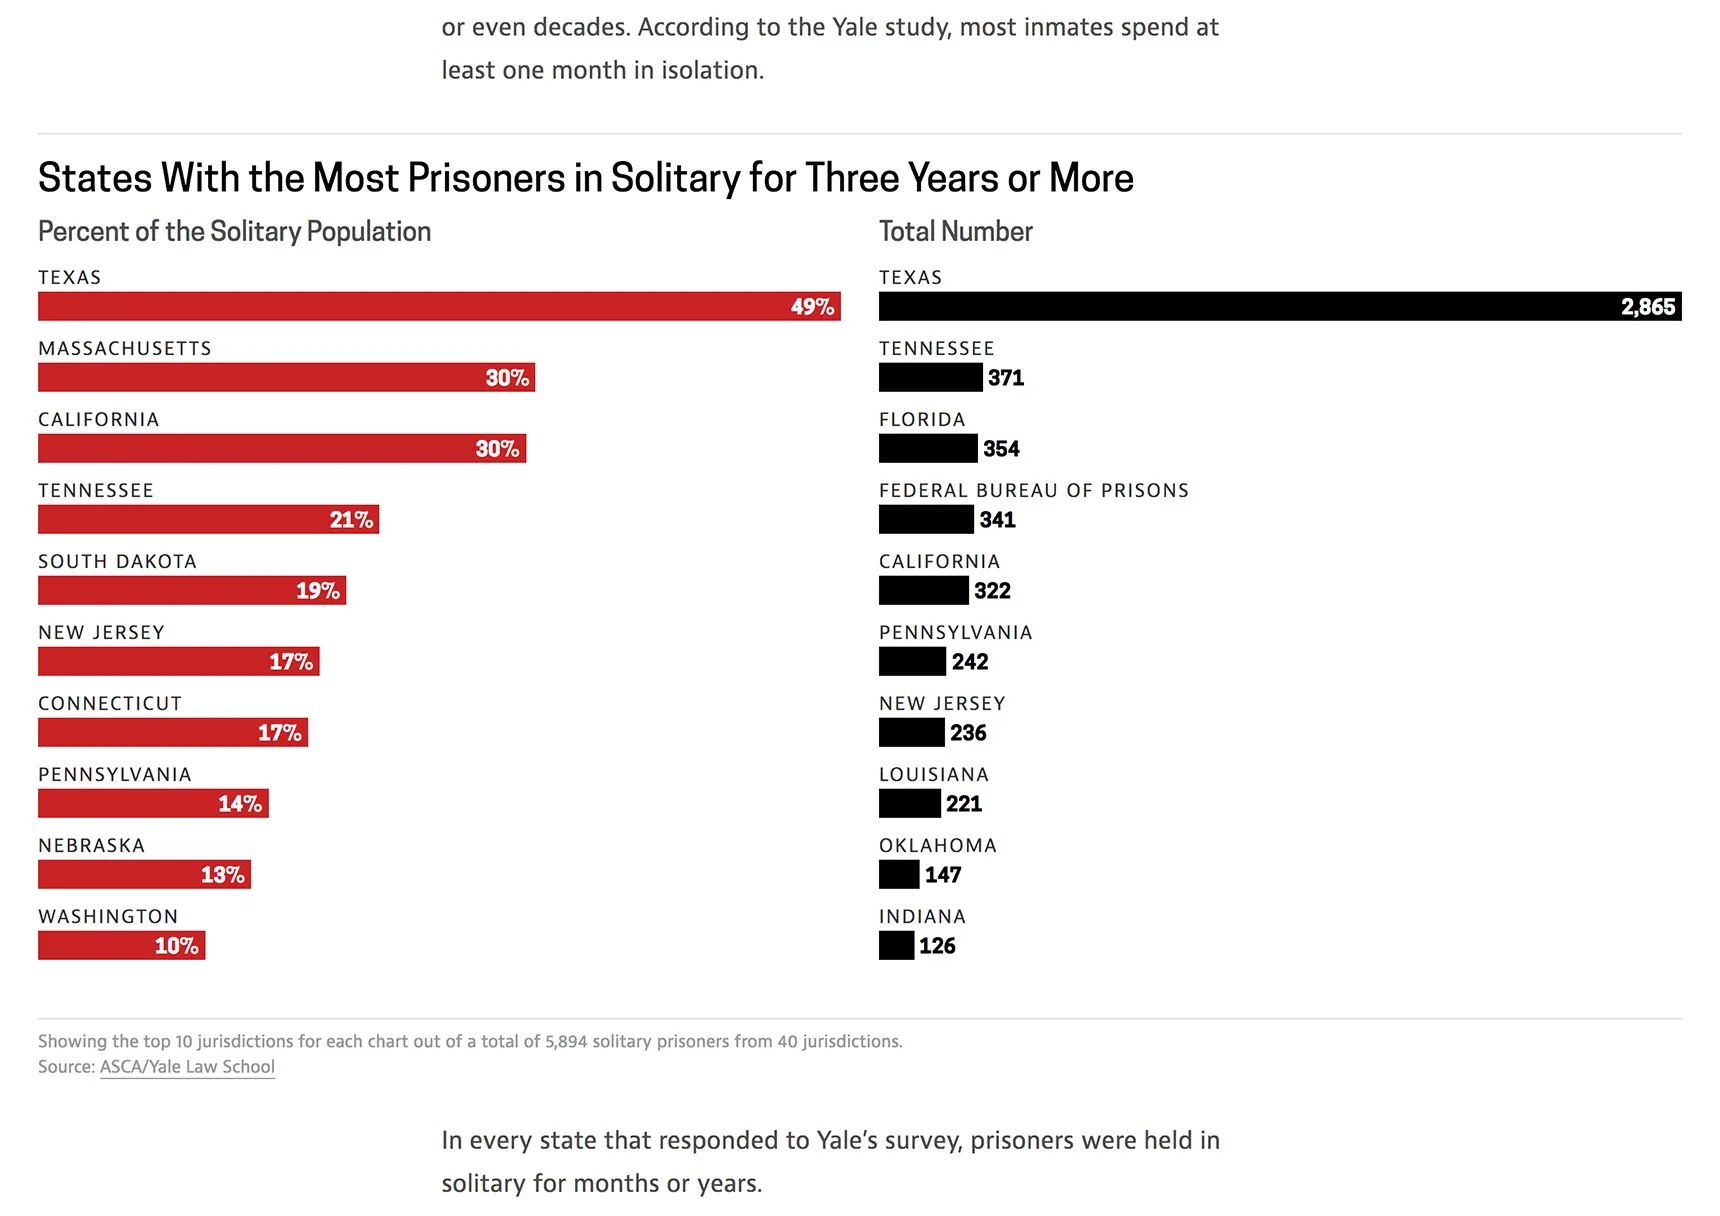
I chose a simple palette of red and black to communicate the data, where the red is used for emphasis. Elegant and minimal visual design works well for our brand and lets the data and the story play the primary role.